
Most automation ROI calculators are built to produce a yes. They count the hours saved, ignore the work of running the automation and stop at the payback month. A calculator you can defend does the opposite: it starts with a measured baseline, includes the full cost of ownership and shows how the answer changes when the assumptions move.
This guide is a template for building that calculator in a spreadsheet or a small internal tool. It does not supply market rates or benchmark savings, because those belong to your process, your invoices and your team's time.
What the calculator must include
A complete model has five parts: the process boundary, the baseline, the benefit lines, the cost lines and the timing. Without the boundary, benefits are counted twice. Without the timing, a project looks profitable in year one when the cash has already gone out.
- Boundary: where the process starts and ends, and which teams are inside it.
- Baseline: volume, handling time, waiting time, error and rework, and cycle time.
- Benefits: capacity released, errors avoided, speed gained and risk reduced.
- Costs: discovery, build, licences, integration, data clean-up, training, support and internal time.
- Timing: when costs are incurred and when benefits actually arrive.
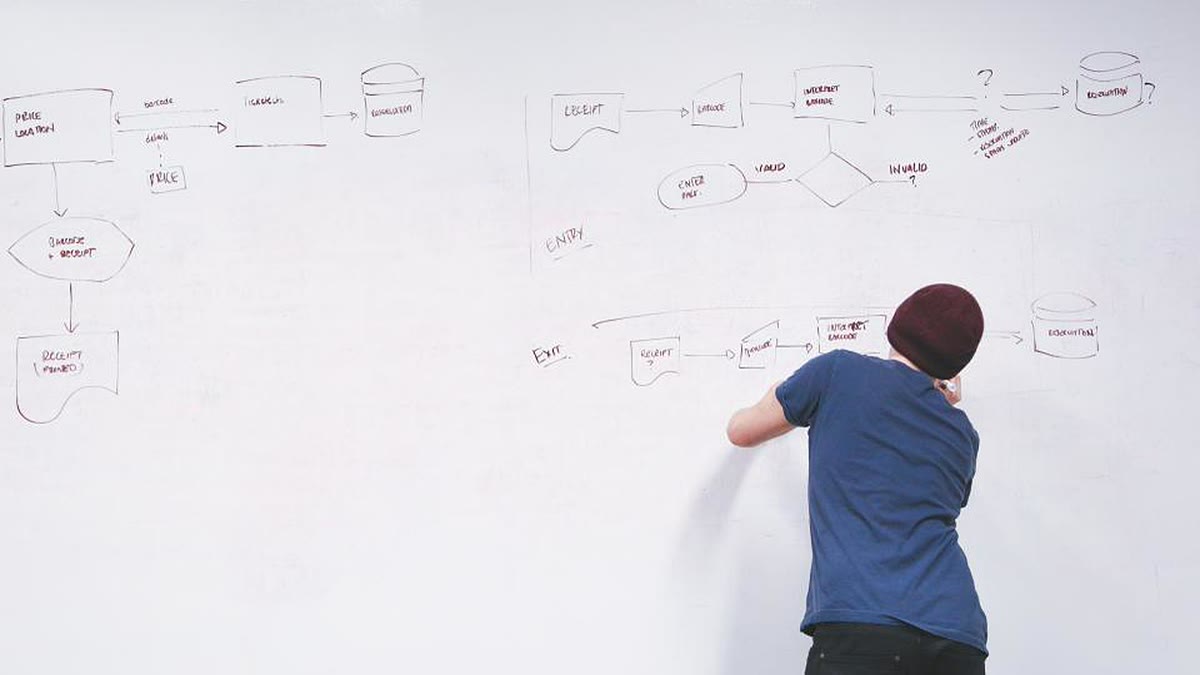
Step 1: draw the process boundary
Write down the trigger, the steps, the handoffs and the end event. For an invoice process, the boundary might run from receipt of a supplier invoice to approval and payment scheduling. Do not include the entire finance function; the wider the boundary, the easier it is to claim savings that belong to another change.
List the systems and people involved, including the exceptions. Automation usually improves the standard path and leaves exceptions to people, so the model must separate standard and exception volumes.
Step 2: baseline the current process
Use evidence, not recollection. Pull volumes from the system report, time a sample of transactions, count rework from the error log and ask the team where waiting occurs.
- Volume: items per month, split by type and peak.
- Handling time: minutes of active work per item, measured across the people who touch it.
- Waiting time: elapsed time between steps, which is often larger than handling time.
- Error rate: items requiring correction, and the minutes spent correcting them.
- Cycle time: from trigger to completion, including queues.
- Fully loaded cost: salary, benefits, supervision and tools for the roles involved.
Record the source and date for every number. A baseline that cannot be traced will be argued about instead of used.
Step 3: list the benefit lines
Translate process improvement into financial lines, and separate cash savings from capacity released.
- Capacity released: hours freed, valued at the loaded rate. This is only a cash benefit if you reduce overtime, avoid a hire or redeploy the time to revenue work.
- Error and rework avoided: correction hours, penalties, refunds and write-offs that disappear.
- Cycle time: earlier collection, faster quoting or reduced inventory holding, converted into a cash effect.
- Compliance and audit: reduced manual evidence gathering and fewer exceptions.
- Customer response: faster service, measured by a metric the business already tracks.
- Avoided hiring: a planned headcount increase that no longer happens, with the timing stated.
Do not count the same hour twice. If a redeployed hour is also counted as new revenue, the model needs an explicit conversion and a sensitivity case.
Step 4: list the full cost lines
- Discovery and process design: workshops, mapping and requirements.
- Implementation: configuration, custom code, testing and project management.
- Licences and usage: per user, per transaction, per bot or platform fee.
- Integration: connectors, APIs, middleware and the ongoing monitoring of failures.
- Data clean-up: deduplication, field completion and migration.
- Training and change management: time to learn, new roles and documentation.
- Run and support: support contract, monitoring, updates and internal administration.
- Internal time: the hours your team spends on the project and on exceptions after go-live.
Include a contingency for scope you have not discovered. Automation projects often reveal process problems that were previously hidden by manual workarounds.
Step 5: put the cash flows on a timeline
Build a monthly or quarterly table. Costs usually arrive early; benefits ramp as adoption improves. Show implementation, pilot, rollout and steady state as separate periods, and do not assume full benefit in the first month.
If the automation replaces a monthly licence, the old cost ends when the contract ends, not when the project starts. If staff are redeployed rather than released, the cash saving may be zero even though capacity improved. State which assumption you are using.
Step 6: calculate payback and net benefit
Use three measures and keep the formulas visible:
annual net benefit = baseline annual cost - future annual cost - annual run cost
payback months = one-time cost / monthly net benefit
three-year net = sum of monthly net benefit over 36 months - one-time cost
Payback is easy to explain but ignores what happens after the payback date. A three-year view shows whether the run cost erodes the benefit. For larger projects, add a discounted cash flow using a rate your finance team accepts, and show the result alongside the simple payback.
Step 7: test the assumptions
Change one variable at a time and record the result. The goal is not a single number; it is a range and an understanding of which assumption matters most.
- What if the volume is half the estimate?
- What if handling time falls by less than expected?
- What if adoption takes two quarters longer?
- What if the licence price rises at renewal?
- What if the process needs an exception team anyway?
- What if the integration is delayed by the vendor?
If the project only works under the best case for three variables at once, it is not ready for approval. Define the evidence that would change the decision and collect it during the pilot.
Common mistakes
- Counting gross hours saved as cash without deciding what happens to the capacity.
- Omitting internal time, training and exception handling.
- Ignoring the old system's exit cost and the new system's run cost.
- Double counting a benefit across two process steps.
- Using a vendor's claimed payback instead of your own baseline.
- Comparing a one-year benefit with a three-year cost.
A checklist before approval
- The process boundary is written and agreed by the process owner.
- Baseline volumes, times and error rates have a source and date.
- Benefits are split into cash and capacity, with a stated use for released time.
- All implementation, licence, integration, training and run costs are included.
- The ramp-up period and old-contract exit are modelled.
- Payback, three-year net benefit and sensitivity cases are visible.
- A pilot metric and a stop rule are agreed before work starts.
Where this fits in our work
If you want the process measured before a tool is chosen, start with Custom Software and Integrations. The pricing page explains how discovery and pilots are scoped. For the budget view around it, read how SME IT budgeting changes as the business grows.
Sources
- HM Treasury, The Green Book: appraisal and evaluation in central government, accessed 17 November 2026.
- Microsoft Learn, Power Automate documentation, accessed 17 November 2026.
- NIST AI Risk Management Framework, accessed 17 November 2026.
- ISO/IEC 42001:2023, AI management systems, accessed 17 November 2026.


Responses (0)
No comments yet. Add the first one below.
Leave a response
Your email address will not be published. Required fields are marked *.